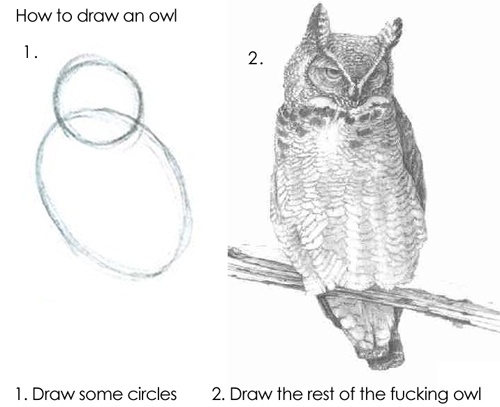
class: center, top, title-slide .title[ # Quantitative Data Management ] .subtitle[ ## CRMW Workshop 2 ] .author[ ### Charles Lanfear ] .date[ ### 3 Feb 2025<br>Updated: 2 Feb 2026 ] --- # Today A research question: .text-center[ *Adjusting for population **density**, how is **deprivation** related to **crime** in London?* ] <br> <!-- --> <br> -- .pull-left[ Today we will: * Create a basic project * Load data we will need * Prepare the data for analysis ] -- .pull-right[ Next time we will: * Visualize our data * Model our outcomes * Diagnose and (try to) address problems ] --- # Setup 1. Open RStudio -- 2. In the project menu (top right) select *New Project...* -- 3. Select *New Directory* * Place it wherever you want -- 4. Using the files tab of the bottom-right panel * Make sure you are in your project's main directory * Create a new `code` folder * Create a new folder called `data` * Create a folders called `raw` and `derived` in `data` -- 5. Browse to this lecture on the course website * [clanfear.github.io/ioc_crmw/](https://clanfear.github.io/ioc_crmw/) --- # The Data Save these to the `data` directory in your project * London Crime data - 2022 + Crime outcomes + [Direct download link (.zip)](https://clanfear.github.io/ioc_crmw/_data/dpu-crime-met-2022.zip) — **multiple files!** + Source: [`data.police.uk`](https://data.police.uk/data/) * LSOA Indices of Deprivation - 2019 + Deprivation predictors + [Direct download link (.csv)](https://clanfear.github.io/ioc_crmw/_data/imd2019lsoa.csv) + Source: [`opendatacommunities.org`](https://opendatacommunities.org/resource?uri=http%3A%2F%2Fopendatacommunities.org%2Fdata%2Fsocietal-wellbeing%2Fimd2019%2Findices) * LSOA Population Density - 2014 + Density control + [Direct download link (.xlsx)](https://clanfear.github.io/ioc_crmw/_data/land-area-population-density-lsoa11-msoa11.xlsx) — a multi-sheet **Excel file!** + Source: [data.london.gov.uk](https://data.london.gov.uk/dataset/super-output-area-population-lsoa-msoa-london) --- # Get to Work! We want to produce **analysis-ready data**: * Cross-sectional (one row per unit) * Columns for predictors * Columns for outcomes -- The process: * **Load and clean** up each file with *separate scripts* * **Save derived data** as *separate files* * **Join together** in another script and save the analysis data -- We'll have *at least* **four scripts**! * We'll start by making `1_process-metro.R` * Numbers make **run order** clear -- .text-center[ *Let's work on this together!* ] --- class: inverse # Cleaning Data <br>  --- class: inverse # Wrap-Up ### Practice! * Data management is the hardest and most time consuming part of any project * You get good with **practice** and **intentional improvement**