class: center, top, title-slide # Trends in Crime, Violence, and Incarceration ## SOC371 ### Chuck Lanfear ### Jan 13, 2020<br>Updated: Jan 12, 2021 --- # Overview 1. Crime Trends * Age Distribution * The Great Crime Decline * Race 2. Incarceration Trends * Race * Drug Offenses 3. Gun Trends * Possession * Violence * Public Opinion and Gun Control --- class: inverse # Crime Trends --- # National Trends Primary sources: * Uniform Crime Report (UCR) + Crimes known to police + **Index Crimes** + Departments covering over 90% of population + Handled by FBI ??? Crimes known to police are not the majority of crimes More serious crimes are more reliably reported; homicides, robberies, serious thefts (insurance) Participation is not mandatory, so some places no covered UCR reporting sometimes inconsistent--better to compare within locality than between them NIBRS--new system--is emerging but doesn't have full coverage -- * National Crime Victimization Survey (NCVS) + Personal victimization + Survey of 50-80 thousand per year + US Census Bureau ??? NCVS leverages expertise of census bureau with stratified multistage cluster sample. Interviews entire household every 6 months over three year period. Problem: Domestic violence Disadvantage: Sample means smaller area estimates not representative or reliable; insufficient power --- # Homicide, Robbery, GTA The most serious crimes peaked in the early 1990s * The "Great Crime Decline" refers to steady drop occurring after this peak 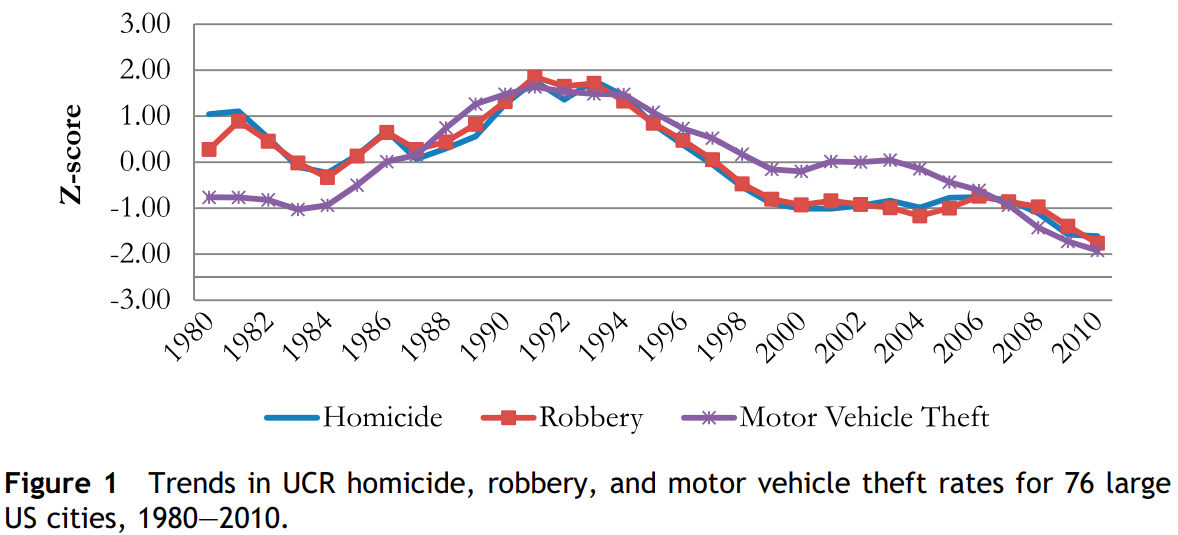 .footnote[Source: Baumer & Wolff (2014)] ??? This is UCR--usually very accurate for these crime types The crime peak was somewhat highly concentrated in city centers Heavily weighted toward gun violence related to drug sales and gangs; racially disparate Homicide rates now look like early 1960s--a bit higher than 1950s which were an all-time low while stats tracked --- # Burglary, Theft Other forms of crime had little or no early 1990s spike * Continuous downward trend since 1980 * Slowed in recent years with some rebounding 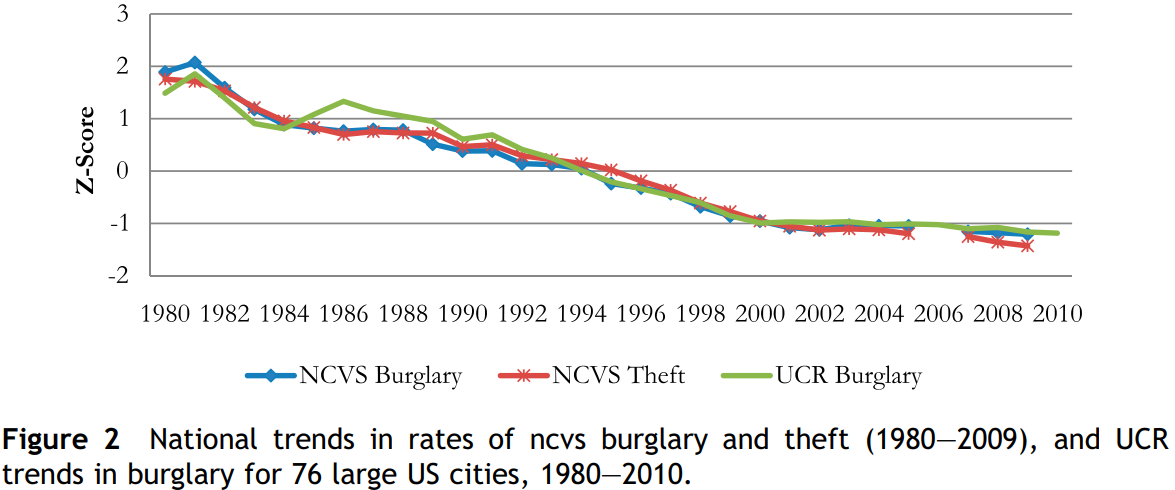 .footnote[Source: Baumer & Wolff (2014)] ??? UCR does not capture these crime types accurately, so this is NCVS Thefts higher than 1960s but otherwise similar--we're at nearly an all-time low --- # The Crime Decline Crime declined rapidly after early 1990s high Some theorized reasons: * Fewer 15-25 year olds * Economic growth: Lower joblessness, higher wages * Crack market decline * Roe v Wade: Fewer crime prone after 1974, fewer 20-25 (Levitt & Dubner) * Police and incarceration (deterrence / incapacitation) * Rise of community organizations (Sharkey) * Reduced involvement in risky behaviors * Gentrification: "Retaking" of city centers --- # Decomposing Trends .pull-left[ <!-- --> ] .pull-right[ <!-- --> ] All cities here actually follow the same general trend ??? Decomposition is a fancy word for separating out different sources of variation In this simple case, every city has a different average level of crime, and every point has random variation But once you remove the shared change they all experienced, all that remains is that different base and random variation Be skeptical of politicians taking credit for crime declines when the trends are similar elsewhere--and even if they aren't, they probably didn't do it either. --- .image-full[  ] ??? Slightly misleading as there was another trough at the start here--but stats not well kept then. Prohibition kept rates up high until 1930s War and post-war period were unique with full employment, massive economic expansion --- # Age-Crime Curve Involvement in crime follows an age-crime curve * Violent crime peaks later (~20) than property crime (~16) * Male crime `\(\geq\)` 5 times female crime + Wider for violent, narrower for (some) property .image-shorter[  ] ??? Crime in general peaks around 16-21. This is a stable empirical reality pretty much everywhere and throughout time All theories of crime must address this to be relevant --- # Homicide by Age .pull-left[ 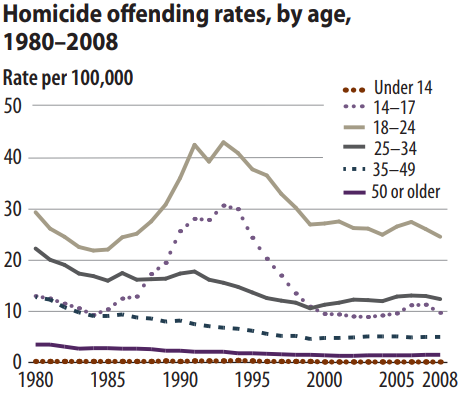 ] .pull-right[ 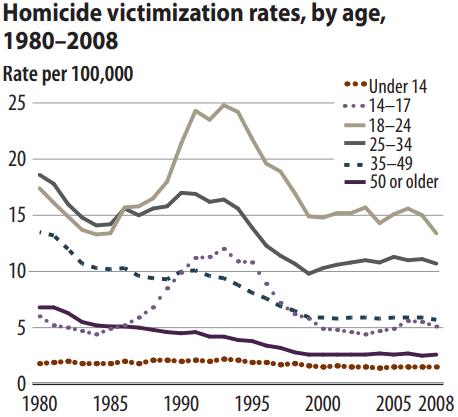 ] * Strong overlap between offenders and victims. * Offending more strongly concentrated in youth than victimization .footnote[Source: Bureau of Justice Statistics] ??? The average age of victims is about 32, of offenders about 28 About 50% of homicide victims know their offender; drastically higher for children --- # Age Distribution Because age is related to crime, changes in age distribution impact crime: * Population Booms * Large Scale Mortality Events * Fertility Declines These can cause massive changes in crime rates many years after they occur. *A large increase in births will produce a large increase in crime almost 20 years later* --- # Baby Booms .image-full[ 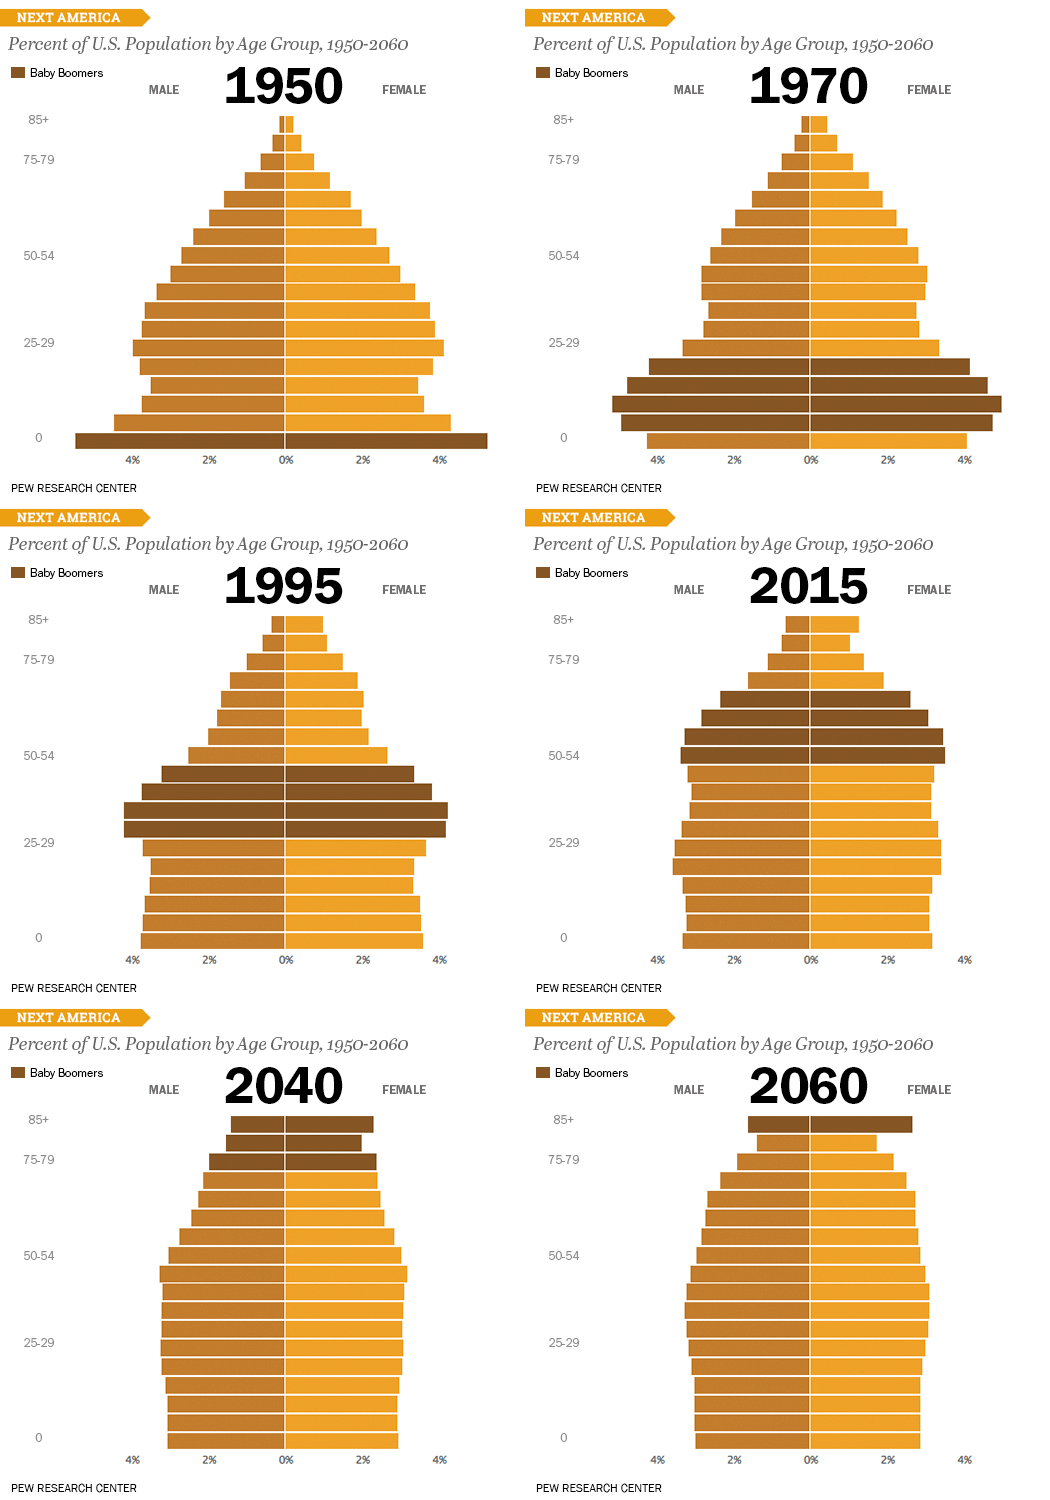 ] .footnote[Source: [*The Atlantic](https://www.theatlantic.com/international/archive/2014/06/the-shifting-shape-of-age-around-the-world/373638/)] --- # Change Over Time There is evidence the curve itself is changing too. 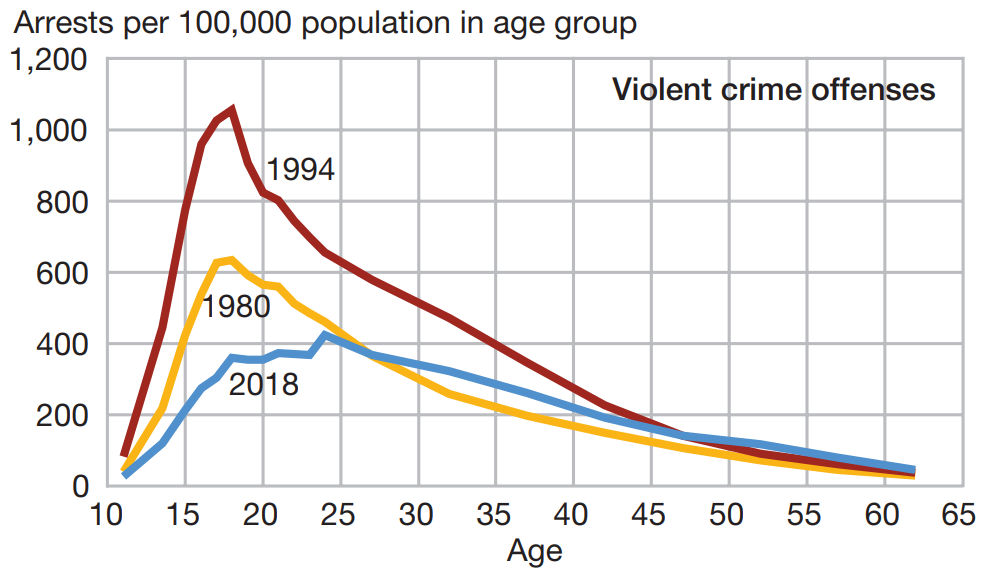 .footnote[Source: Official of Juvenile Justice and Delinquency Prevention] ??? This is Office of Juvenile Justice and Delinquency Prevention data Arrests not same as participation; majority of crimes, especially minor, go unnoticed. May represent changes in policy as well as underlying rates. --- # Homicide by Sex .pull-left[ 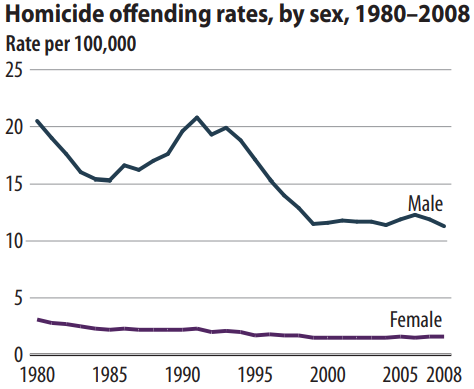 ] .pull-right[ 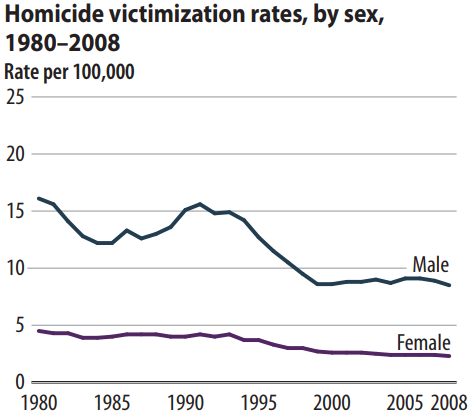 ] .footnote[Source: Bureau of Justice Statistics] ??? Vast majority of murders are committed by men Most victims are also male Nearly all homicides of women are done by men, however --- # Homicide by Race .pull-left[  ] .pull-right[  ] .footnote[Source: Bureau of Justice Statistics] ??? Homicide offending and victimization is highly concentrated in young black male population This is aprticularly the case in the early 1990s We'll get more of a handle on this later when we read Divergent Social Worlds --- # Intra- / Inter-racial Offending .image-full[ 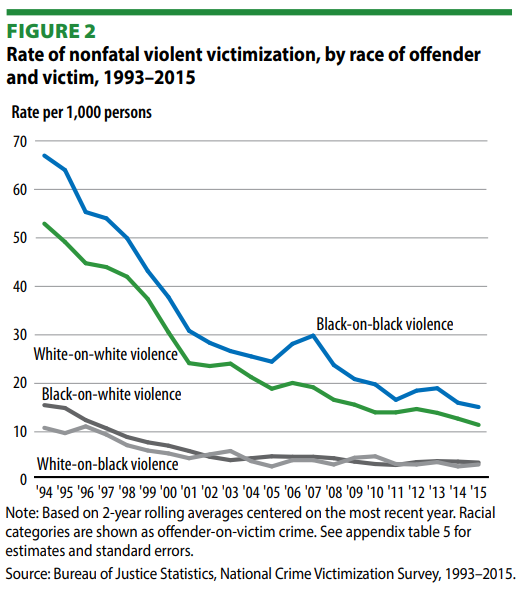 ] ??? The vast majority of violence occurs between people who are acquainted People typically know others like themselves Violence is more concentrated in more segregated areas and among more segregated people (i.e. poorer) --- class: inverse # Incarceration Trends --- .image-full[ 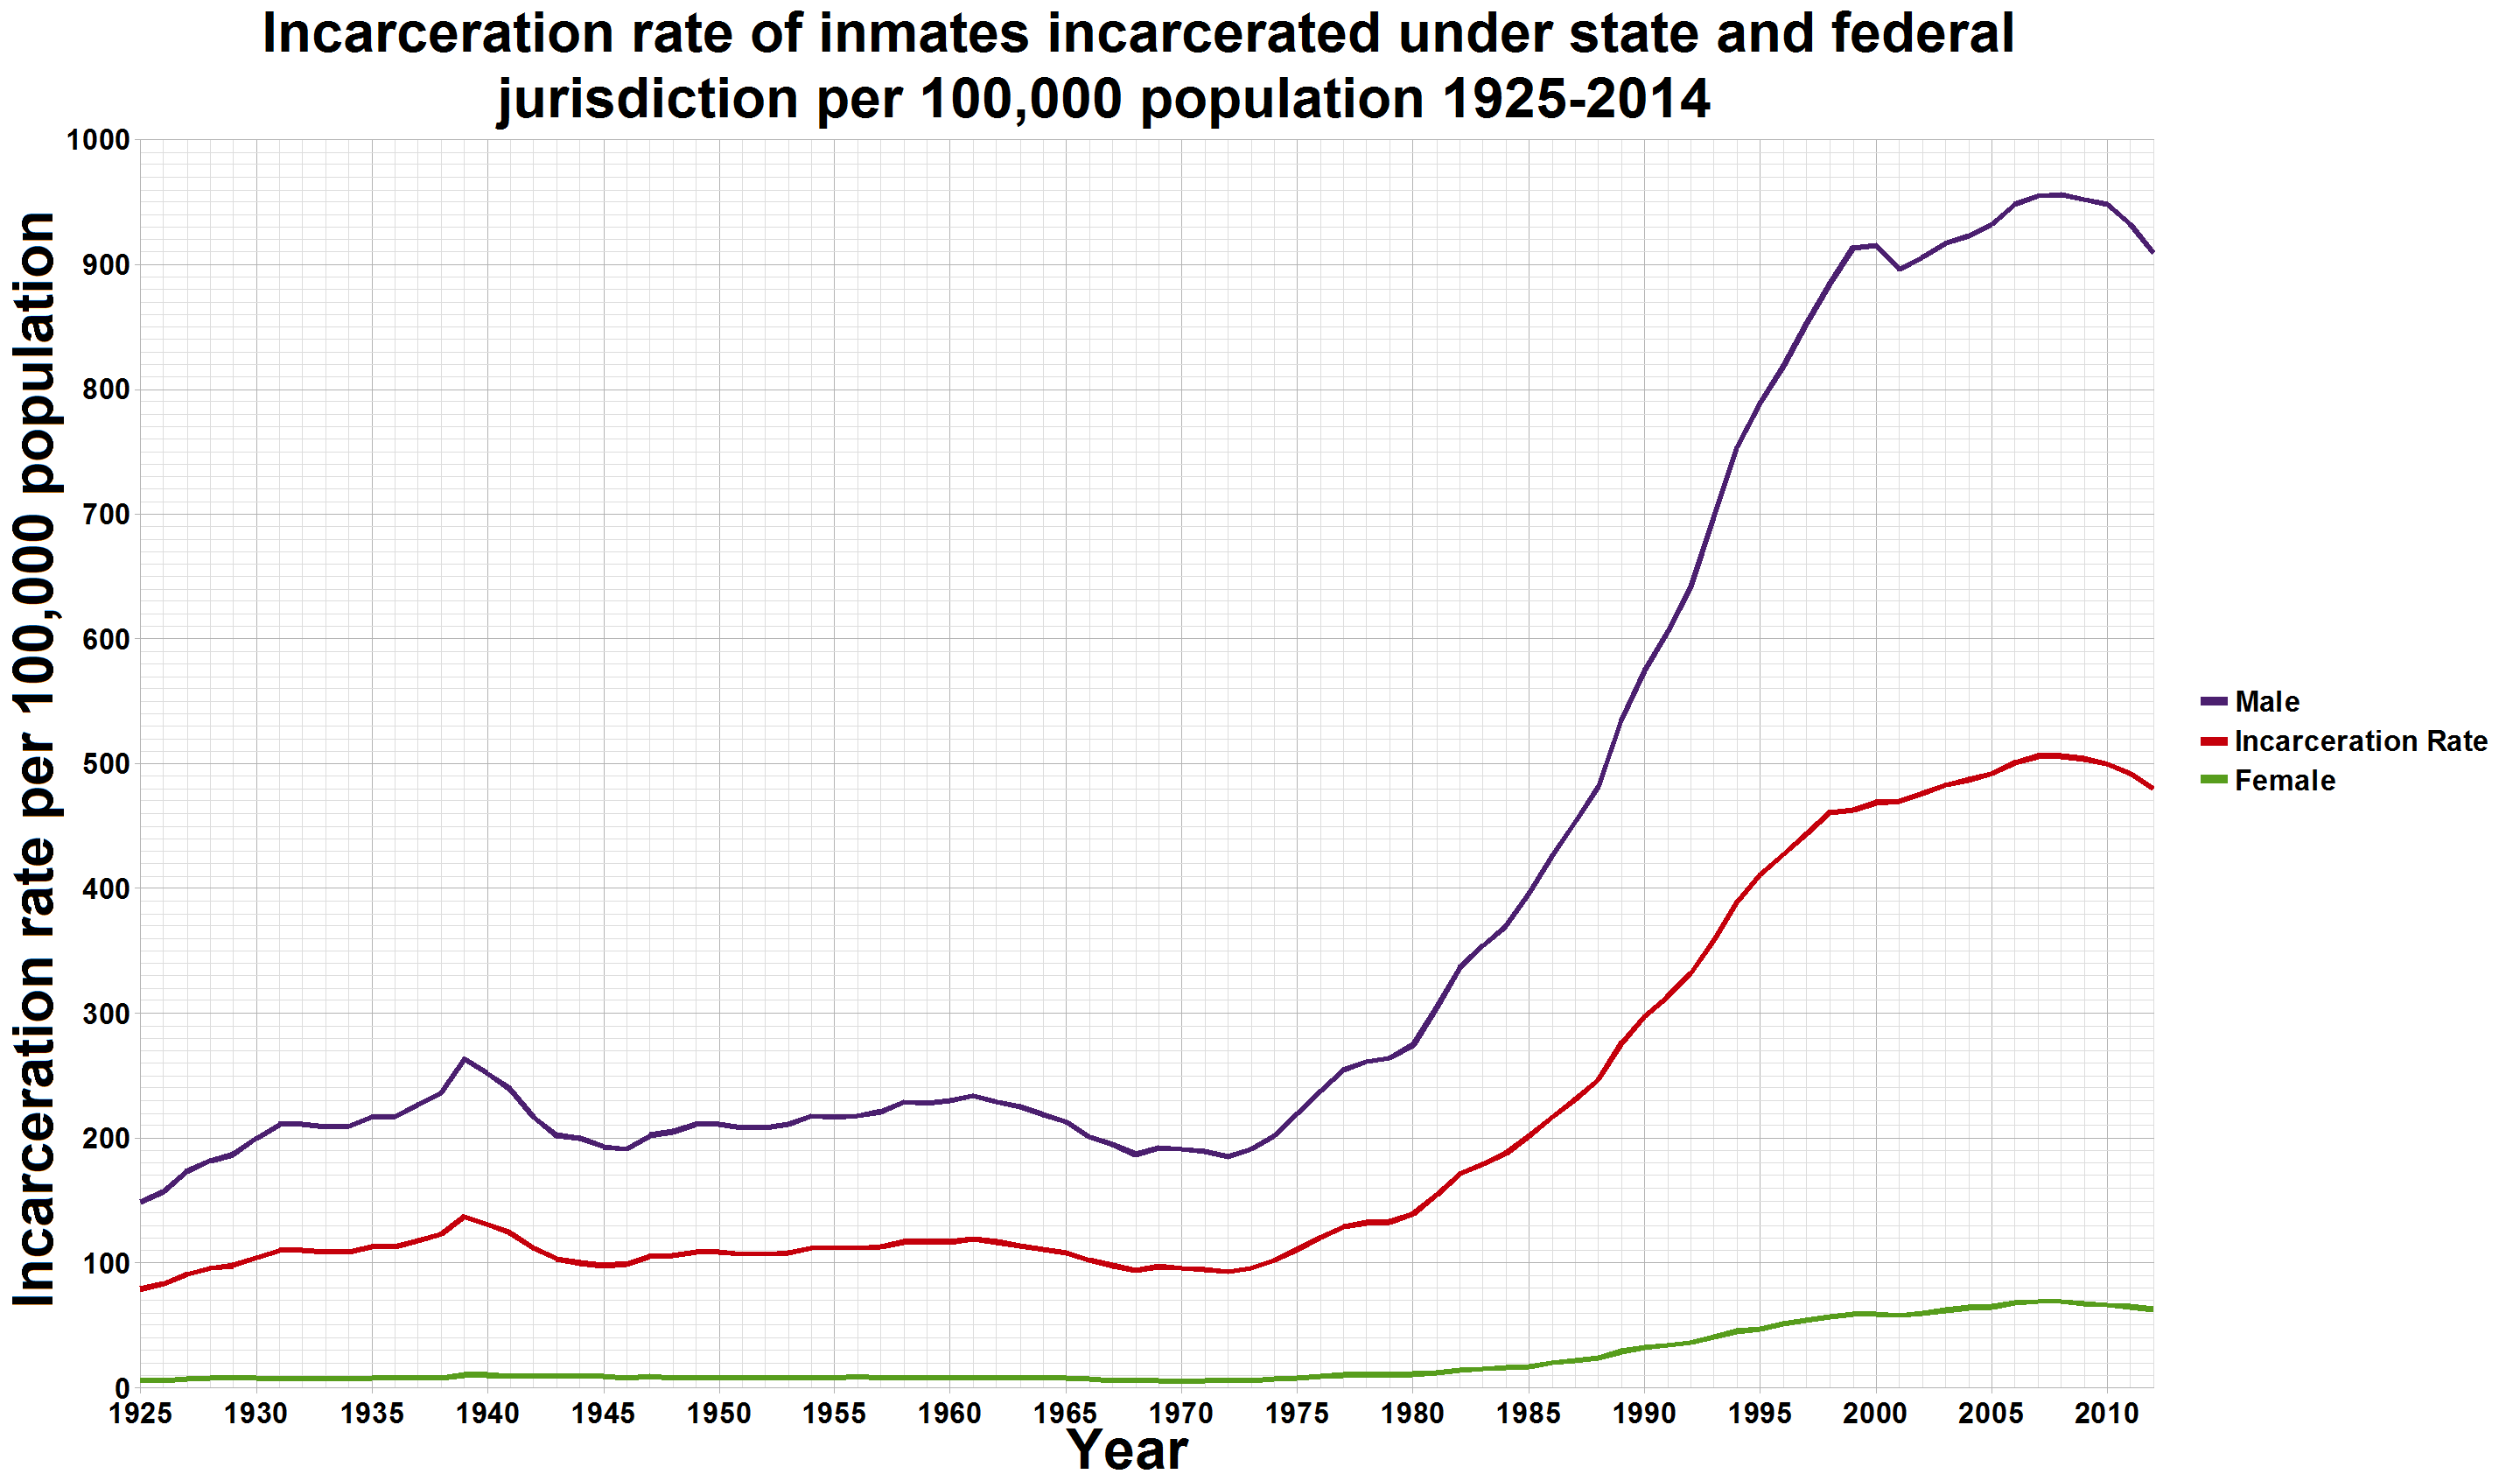 ] .footnote[Source: [Smallman12q, Wikimedia Commons](https://commons.wikimedia.org/wiki/File:U.S._incarceration_rates_1925_onwards.png)] ??? Crime is highly concentrated among males, and incarceration even more so--approximately tenfold difference. In large part because involvement in violence is even more concentrated among men than crime in general. --- .image-tall[ 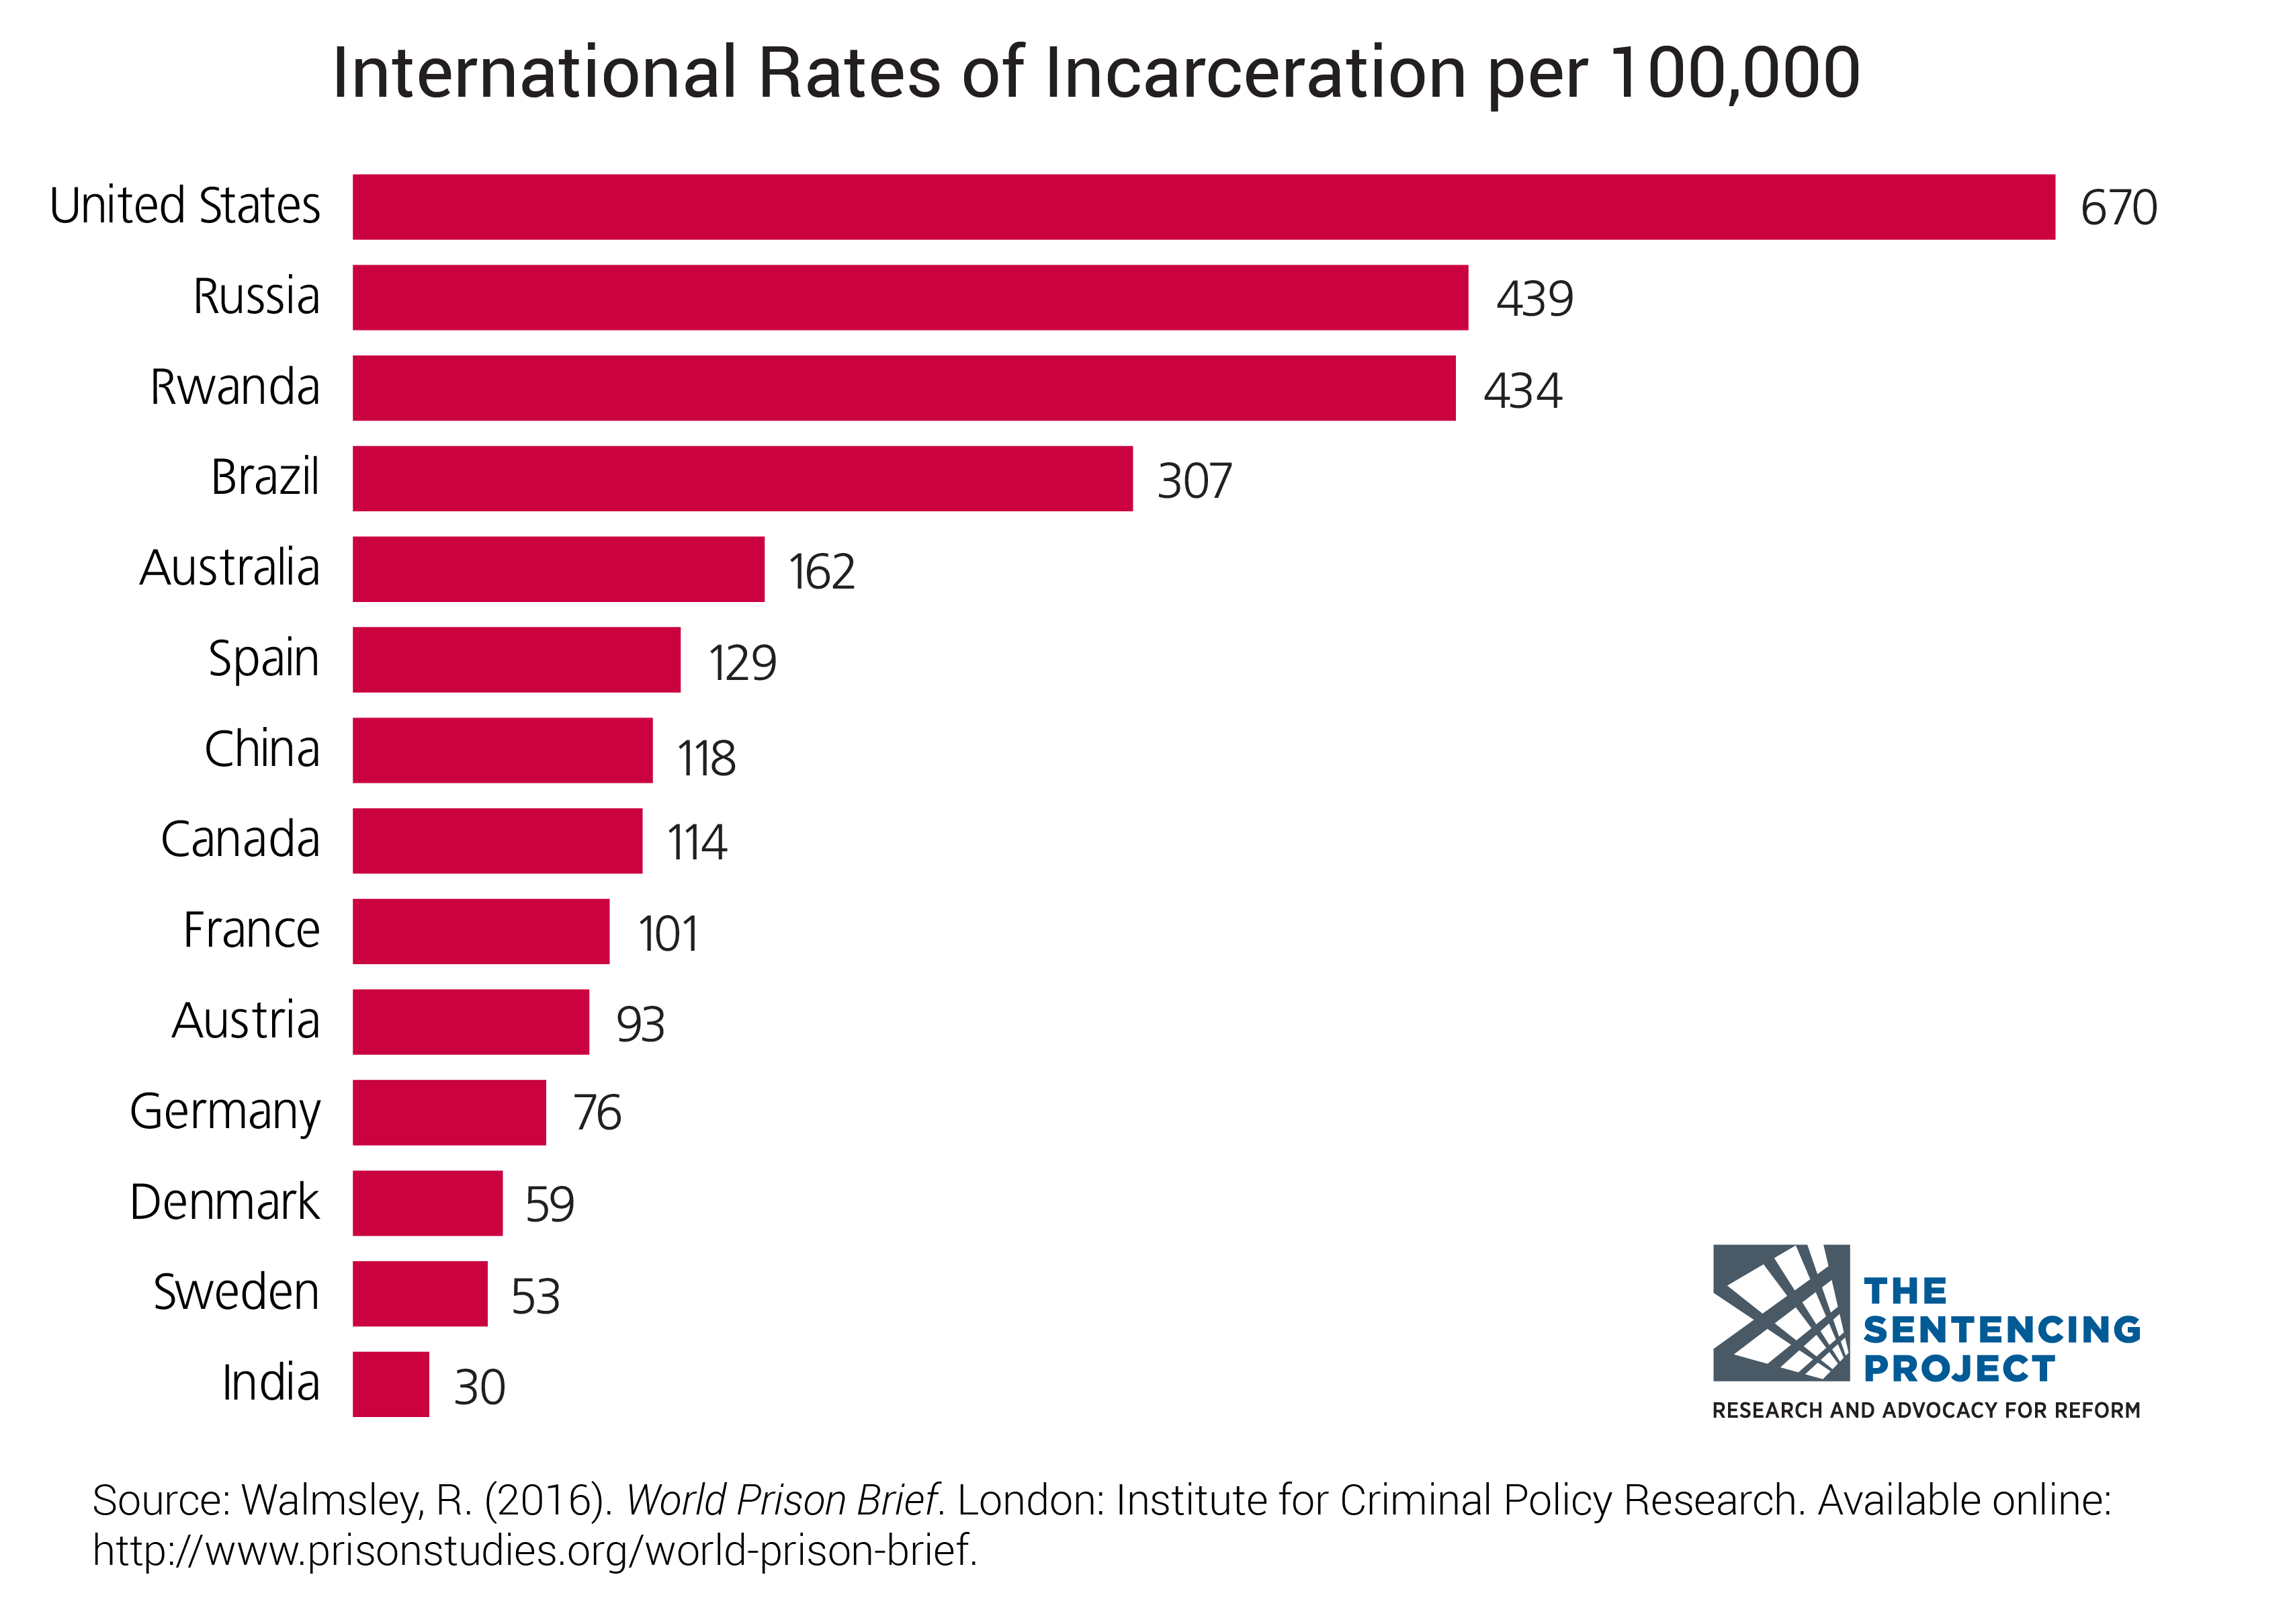 ] ??? We have the highest officially reported incarceration rate in the world It is unlikely that all countries accurately report incarceration statistics, so take them with a grain of salt --- .image-full[ 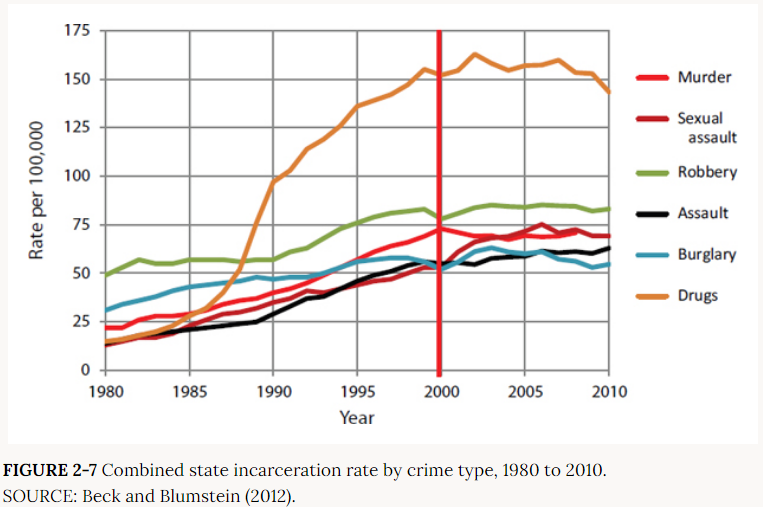 ] .footnote[Source: National Academies (2014) *The Growth of Incarceration in the United States: Exploring Causes and Consequences (2014)*] ??? This plot shows incarceration rates by time of crime since 1980. This looks pretty bad, but keep in mind it lumps together all drug crimes while disaggregating violence and not including theft, the most common property crime--rates increased for everything. --- # Race / Ethnicity .image-short[ 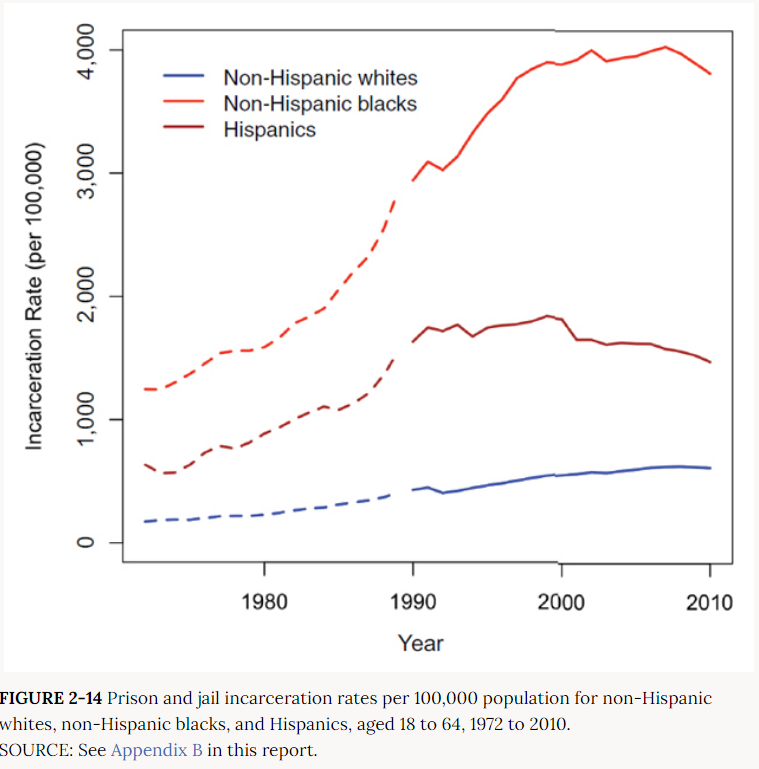 ] .footnote[Source: National Academies (2014) *The Growth of Incarceration in the United States: Exploring Causes and Consequences (2014)*] ??? Increase in incarceration was larger for black and hispanic populations, though whites did see a more than doubling. That's comparable proportional increase for whites and hispanics, but much higher for black. Not illustrated, but on a sidenote, people in prison typically cannot vote--but they get counted for allocating representation. If 50% of the people in your district are incarcerated, each non-incarcerated person effectively counts as two votes. Having a large prison in your area can give you a big boost in political power. This results in a shift of political power from urban black and Latino areas (where people get arrested) to rural white areas (where prisons are). There's movements to get that pop reallocated to the pre-incarceration districts of prisoners. --- .image-tall[ 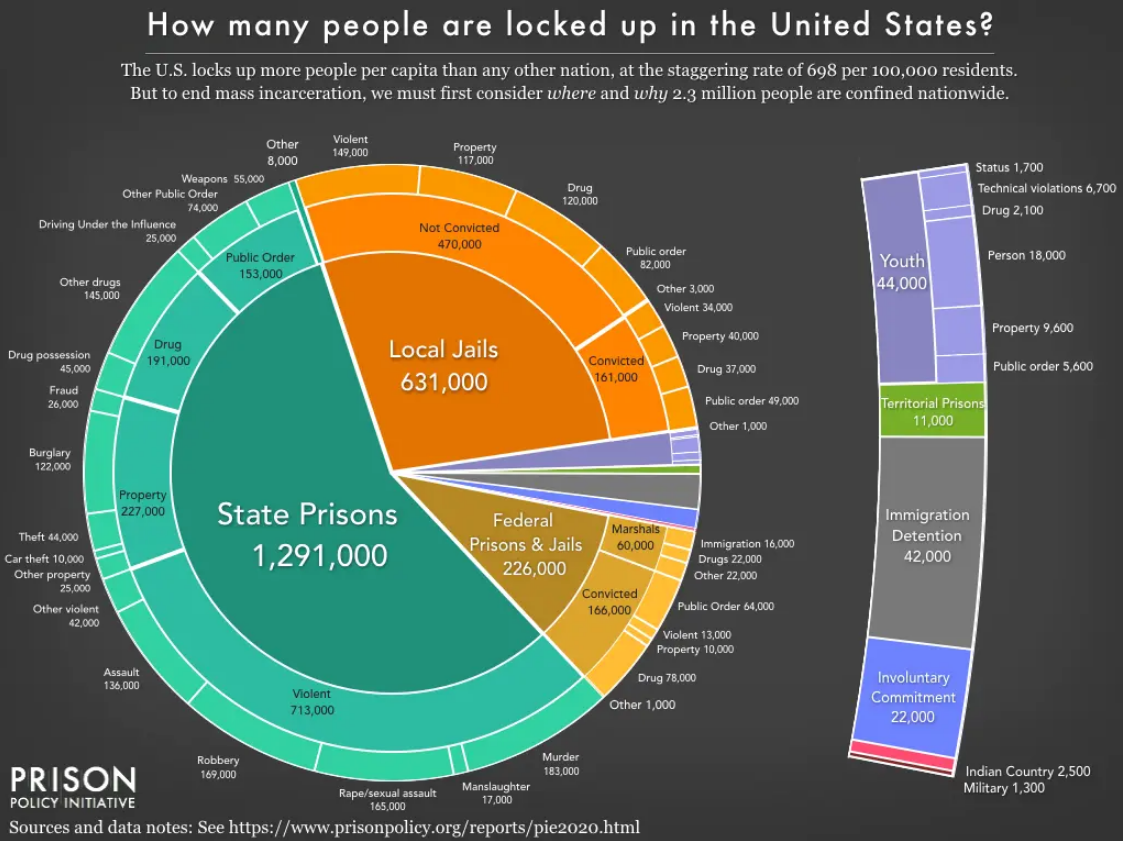 ] ??? Despite war on drugs, current prison population is not dominated by drug offenders Drug offenses often have shorter sentences--more turnover than for violent crimes Increase in incarcerated population due mainly to general increase in sentences across the board People are staying in jail and prison longer than they used to. --- .image-tall[ 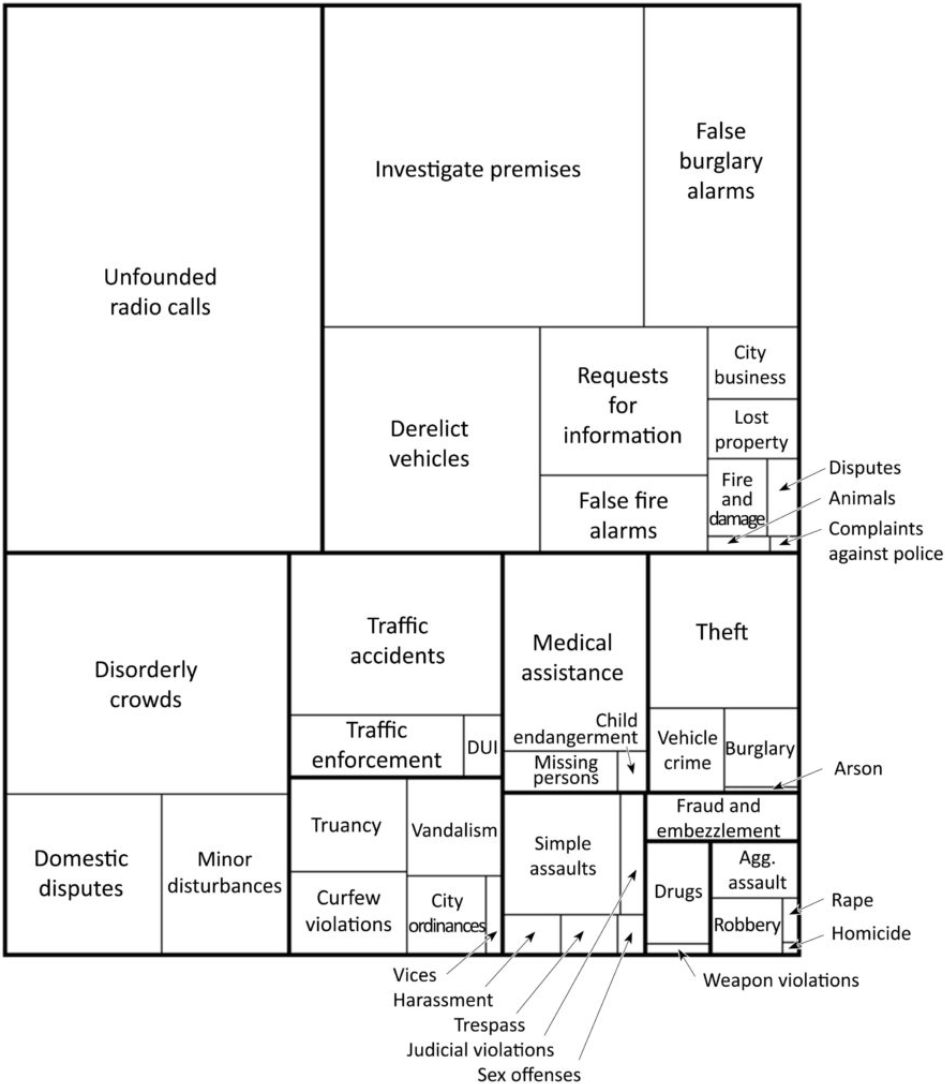 ] .footnote[Source:<br> [Jerry Ratcliffe's Twitter feed](https://twitter.com/Jerry_Ratcliffe)] ??? Added this to satisfy some curiosity many probably have. This is an area chart that shows the amount of different types of calls Philly police responded to in 2019--note this is calls not time spent on calls. More serious calls get more time. Most calls are noncriminal incidents and false alarms--but note they're also largely not social service calls. Rather, most calls deal with public order issues. But for the rest, there is about an equal number of calls for serious crimes and calls that might be classified as medical or social services--though in many cases the police are responding as escort for medical or social service providers. If you looked at time spent, rather than raw calls, the more serious events would greatly increase in size. --- # Drug Arrest Trends by Race .image-short[ 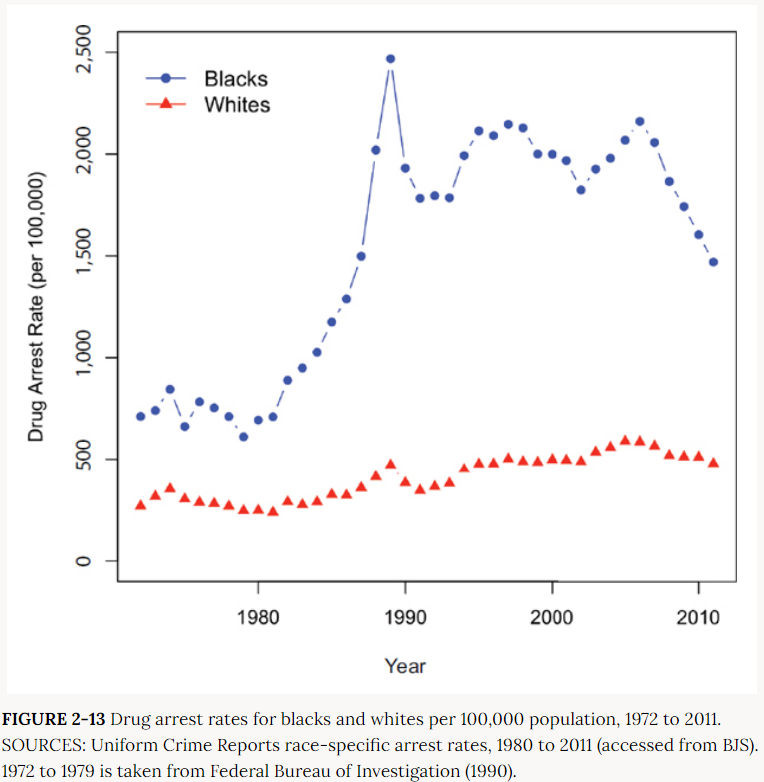 ] .footnote[Source: National Academies (2014) *The Growth of Incarceration in the United States: Exploring Causes and Consequences (2014)*] ??? Back to arrests for drugs Massive increase in arrests mainly seen for black individuals Another thing to note is most policing is reactive and there's good evidence people are more likely to call the police on black and Hispanic people. Police are also disproportionately deployed to minority areas--in particular to target drug markets. You don't need any individual officer bias to generate these outcomes--the issue is structural. --- # Drug Use by Race .image-full[ 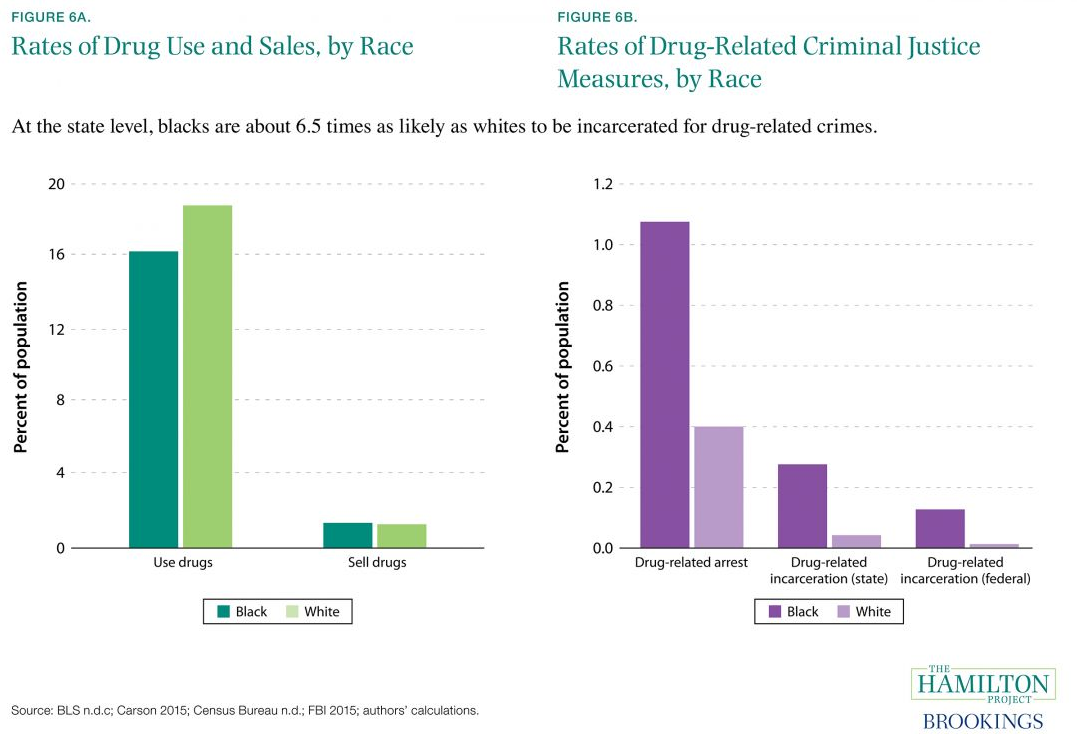 ] .footnote[Source: [The Hamilton Project](https://www.hamiltonproject.org/charts/rates_of_drug_use_and_sales_by_race_rates_of_drug_related_criminal_justice)] ??? Substance use tends to be somewhat higher for whites than blacks Highest groups typically AINA; Hispanic lower than black, Asian lowest Pattern of arrest and incarceration follows concentration of police attention more than patterns in use or sales One major reason is most white use and sales occur in private premises where it goes unseen; poorer folk hustle and use on the street --- class: inverse # Guns --- # Second amendment "A well regulated Militia, being necessary to the security of a free State, the right of the people to keep and bear Arms, shall not be infringed." -- * State vs. Federal Power ??? Framers of constitution were suspicious of federal government; state-regulated militias were thought to protect from federal government Complex though: Conception is that one cannot ban arms because citizens make up the militia; guns typically owned by individuals -- * Collective Right vs. Individual Right ??? Conception of individual right to bear arms--as opposed to collective state-level--is basically nonexistent until 1960s and was not legally mainstream until 2000s, even among conservative justices. -- * *District of Columbia v. Heller* (2008) ??? Case established precedent for individual right to gun ownership independent of militia and including for self-defense. Issue more or less settled for now barring a constitutional amendment--common law precedent has established an individual right. --- .image-tall[ <!-- --> ] ??? Top 10 gun ownership countries over 10 million pop. US civilians own just shy of 400 million firearms, which is estimated to be about 46% of all guns in the world That's about three times the firearms held by all militaries in the world combined (133 million). Gun ownership in US (vs Europe) is more heavily weighted toward handguns; direct comparisons of gun counts are misleading as handguns are generally the issue--most homicides involve handguns. --- .pull-left[ .image-full[ Gun Ownership Across States  ] .footnote[Source: [Ali Zifan, Wikimedia Commons](https://en.wikipedia.org/wiki/File:Gun_owners_as_a_percentage_of_each_state%27s_population_in_2007.svg)] ] .pull-right[ <br> .image-full[ 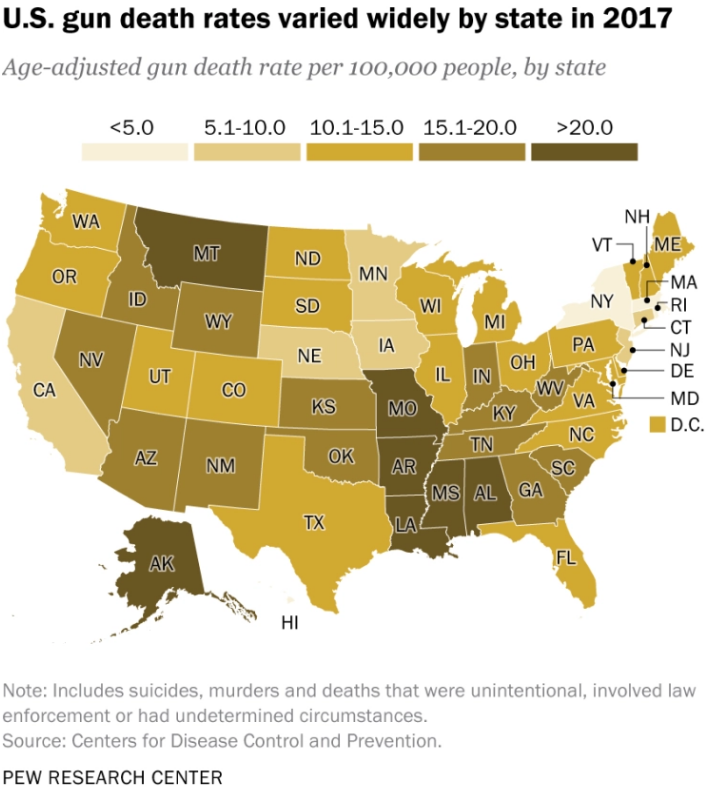 ] ] ??? Overall gun death rates are correlated with gun ownership by state. Gun homicide rates exhibit a weaker correlation because of the rural vs. urban issue--will get to that --- .image-short[ 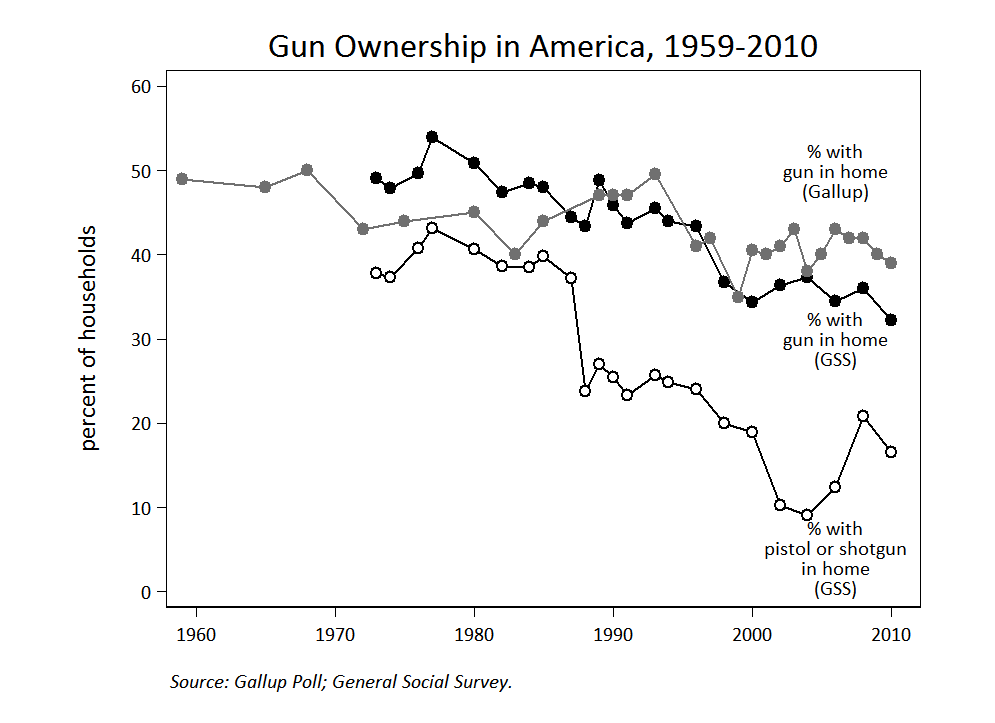 ] * Gun *ownership* is declining + In 2016, approximately 22% of adults owned guns * *Concentration* of gun ownership is increasing + 3% of citizens own half of US guns, averaging 17 each .footnote[Sources: [Patrick Egan, Monkey Cage](https://themonkeycage.org/2012/07/the-declining-culture-of-guns-and-violence-in-the-united-states/), [The Guardian](https://www.theguardian.com/us-news/2017/nov/15/the-gun-numbers-just-3-of-american-adults-own-a-collective-133m-firearms)] ??? The number of people owning guns is dropping over time, but the number of guns owned is increasing. --- .image-tall[ 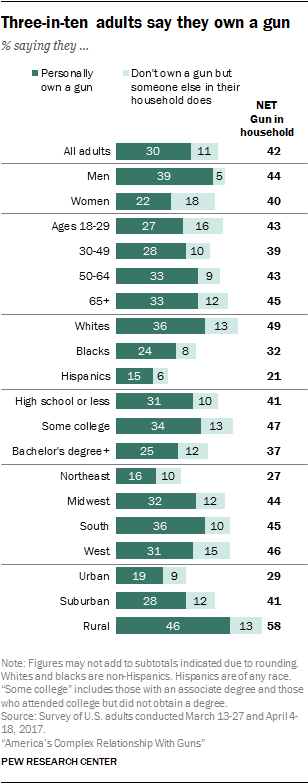 ] ??? Gun owners tend to be older white males in rural areas Urban gun ownership is uncommon The highest risk group for firearm violence is young black males who have low rates of gun ownership in general --- .image-short[ <!-- --> ] * Most gun deaths are suicides * Mass shootings are small component of overall death count * [Police account for approximately 8% of adult male homicides (Edwards, Esposito, & Lee 2018)](https://ajph.aphapublications.org/doi/abs/10.2105/AJPH.2018.304559) ??? Can't disaggregate above by police, but vast majority of police homicides are shootings. --- .image-full[ 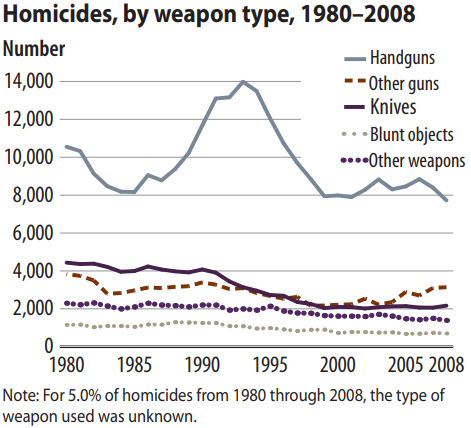 ] .footnote[Source: [Bureau of Justice Statistics](https://www.bjs.gov/content/pub/pdf/htus8008.pdf)] * Handguns used in vast majority of homicides + Most handguns in homicides acquired illegally or through transfers ??? Legality of firearms involved in crime is not well recorded What work has been done suggests majority are obtained via direct theft, sale of stolen weapons, or unrecorded transfers. This means most homicides are attached to guns--but those guns aren't acquired through legitimate channels At the initial stage, however, they were purchased legally, so there is a lot of concern about minimizing thefts or transfers and tracing weapon origins. --- # Assault Deaths in US vs. OECD .image-full[ 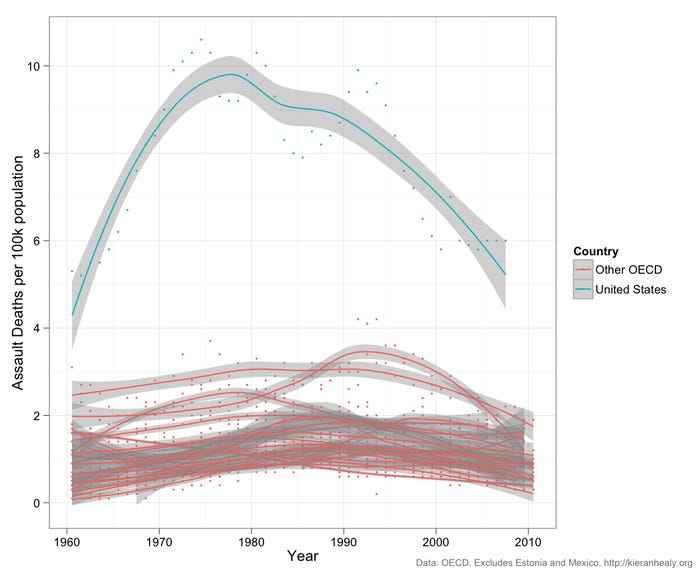 ] ??? These are assault deaths compared to similar OECD countries. Most assault deaths are firearms in US. Lower firearm death rates elsewhere. Not a good look Actual rates of assault are not this out of proportion--we have roughly similar assault rates to rest of OECD. The issue here is more effective weapons in course of assaults--primarily handguns. --- # Assault Deaths in US vs. OECD .image-full[ 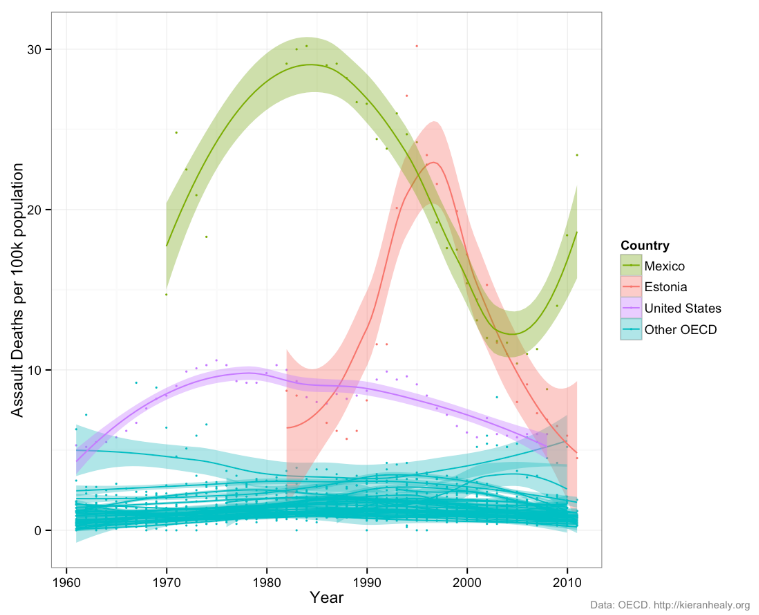 ] ??? Bringing in some excluded OECD countries--Mexico and Estonia--it makes US look a little better Until you consider Mexico has a continuous drug war going on. Recent spike back up was beginning of Calderon's militaristic approach to cartels. Estonia had serious issues with drug crime, organized crime, and alcohol abuse after gaining independence and shifting to market economy. It now has a lower homicide rate than the US. --- # Assault Deaths by US Region .image-full[ 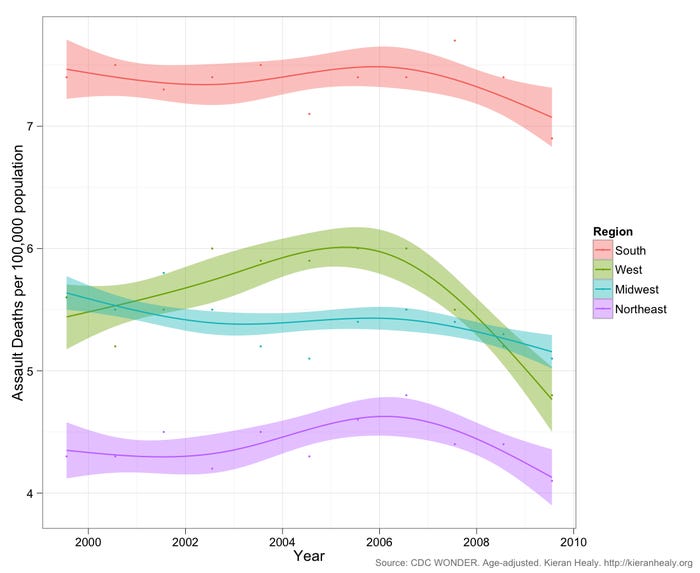 ] --- # Gun Homicides in US cities * Gun homicides are concentrated in cities + Great heterogeneity between cities * Seattle: 3.7 per 100k * St. Louis: 66.1 per 100k + Within cities, concentrated in small area ??? Gun homicide rates--not just counts--are much higher in urban areas than rural Gun homicides are concentrated in small number of cities, small areas within those cities Differences in violence often don't map to other crimes: St. Louis only about 20% more property crime than Seattle -- * Gun ownership is low in cities + Gun ownership high for urban residents involved in crime ??? Gun ownership is a rural thing, but gun homicides are an urban thing Relationship is complex. --- .image-tall[  ] ??? This plot compares firearm homicide rates in US cities to comparable countries Note that within the comparison countries, they have individual cities with similar concentrations --- .image-short[ <!-- --> ] * Weapons in mass shootings are usually obtained legally * Handguns and long guns used equally + Long guns account for 1.4 times as many deaths ??? Mass shootings look very different from other homicides --- .image-short[  ] * Mass shooting events typically do not increase support for gun laws + Response is largely increased polarization + Gun sales *rise* after publicized shootings --- # Specific Gun Policies .image-full[  ] --- # Guns as Facilitator Firearms are most effective weapon available for most violence + Those predisposed to violence will seek out guns + Handguns are also concealable ??? If you're expecting conflict, handguns can be carried all the time If you want to inflict maximum harm, long guns are universally superior This is why mass shootings and conventional homicide are totally different things; can't address the same way; same with domestic violence -- Vast majority of gun owners do not engage in violence + Large number of guns means easy to acquire illegally ??? Ownership only really correlated with domestic violence homicides (and suicides) No one is shipping guns straight to criminals Original source of guns is always some legitimate sale Pathway is through theft or transfers -- This is a public policy conundrum + Gun laws largely target non-criminal owners + Externality problem<sup>1</sup> + Large, politically active, law-abiding gun-owning population + Moral stance on regulation .footnote[[1] "an externality is the cost or benefit that is imposed by one or several parties on a third party who did not agree to incur that cost or benefit" - [Wikipedia](https://en.wikipedia.org/wiki/Externality)] ??? Gun ownership externality: Legal ownership enables illegal gun acquisition via theft. What is unique about guns isn't that people can steal the item and use it illegally, but rather the consequences of that illegal use are unusually severe compared to other things that might be stolen--like drugs. Liberty doctrine of US makes it hard to legally restrict ownership due to this externality, even though the majority of homicides in US can be attributed to it. People do not like idea of regulating people obeying law because of actions of people already breaking law. Firearm owners and lobby are a large and powerful voting block, many of whom share a moral anti-regulation stance. --- class: inverse # Questions --- # For Next Time * Loftin, Colin and David McDowall. 2010. “The Use of Official Records to Measure Crime and Delinquency.” *Journal of Quantitative Criminology* 26(4):527-32. * Ehrenberg, Rachel. 2012.”Reliance on Raw Statistics Makes City Crime Rankings Misleading.” *Science News* 181(12):9 * [Bronner, Laura. 2020. "Why Statistics Don't Capture The Full Extent Of The Systemic Bias In Policing". FiveThirtyEight.](https://fivethirtyeight.com/features/why-statistics-dont-capture-the-full-extent-of-the-systemic-bias-in-policing/) ### Things to pay attention to: Police data should not be taken at face value! * Official crime rates are combination of actual victimization and willingness to call police. * Racial bias is hard to measure with police data